Bargraphs Displays
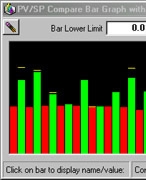
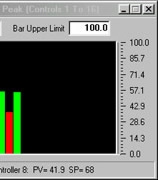
All controllers (process value and setpoint) can be tracked in the bargraph display windows.
Each bargraph (4 groups) displays up to 16 controllers per graph and "auto config's" based on the number of controllers active in the system. Peak lines provide the operator with the max value per point. Continuous channel data is provided for any bar clicked by the user.
 |
 |
Software Tour
- Bargraphs Displays